
How to Import the Grafana Dashboard
Get a ready-made view of Arthur's metrics — request rate, errors, latency, Node.js runtime metrics, and MCP tool/resource metrics — instead of building a dashboard from scratch.
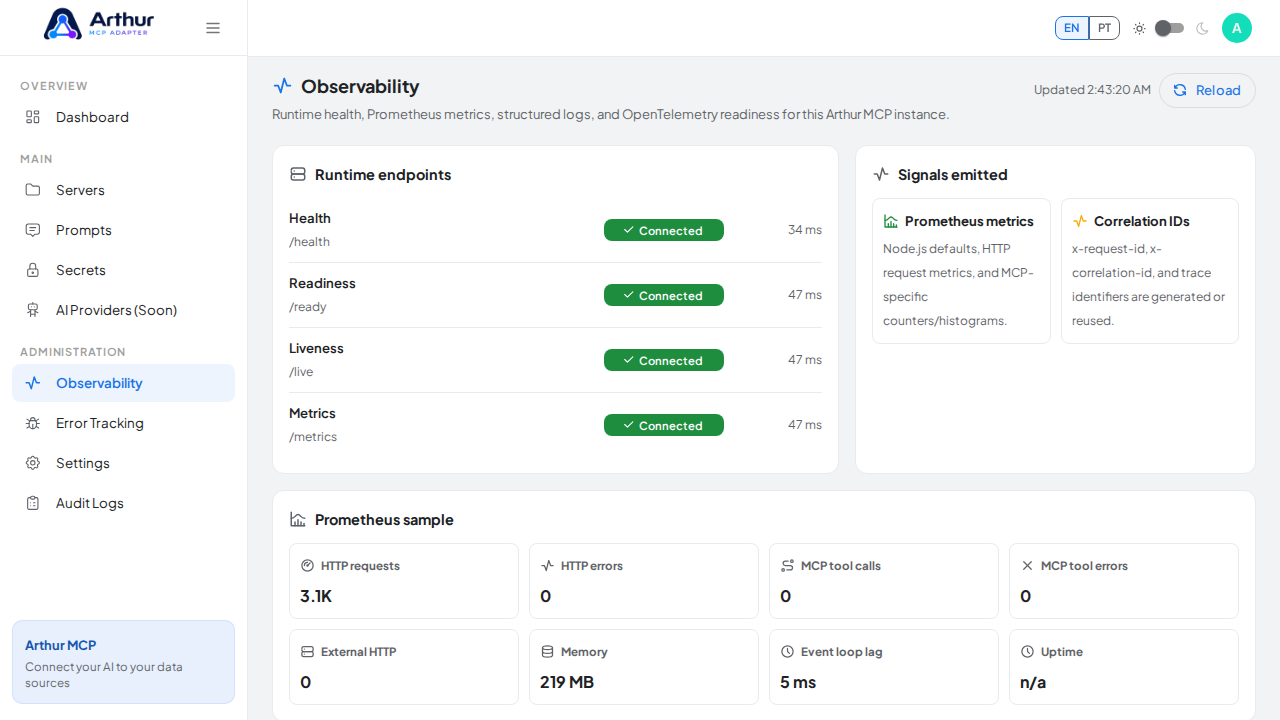
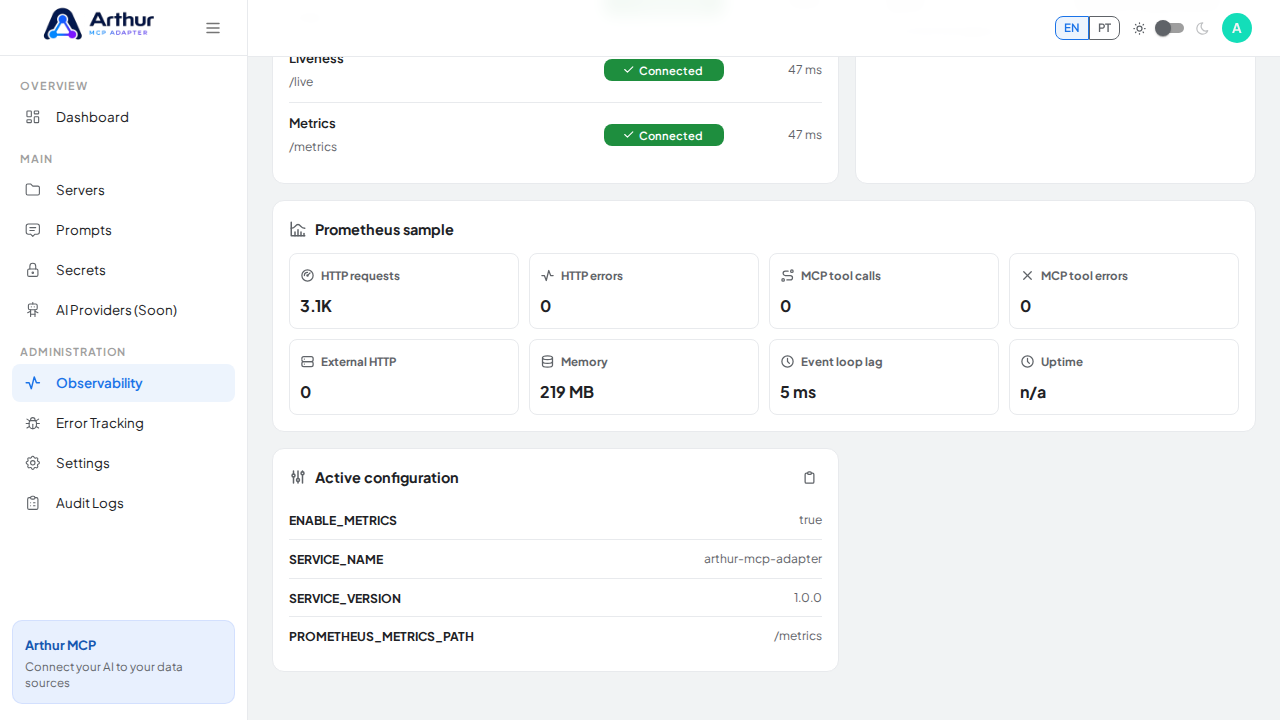
Prerequisites: a running Prometheus instance scraping Arthur's /metrics endpoint, and a Grafana instance with that Prometheus added as a datasource. The repository's observability/ folder has local Docker Compose helpers for Prometheus, Grafana, and Tempo if you don't have your own stack yet.
Steps
In Grafana, go to Dashboards → Import.
Upload
observability/grafana-dashboard.jsonfrom the Arthur MCP repository.
Select your Prometheus datasource when prompted.
Import.
Confirm it worked
The dashboard loads with panels for request rate, errors, latency, Node.js runtime metrics, MCP tool/resource metrics, and external HTTP metrics, all populated from your instance.
Good to know
- If your API doesn't run on the default port, update
observability/prometheus.ymlso Prometheus scrapes the right address.
Related
Tutorial video