Observability
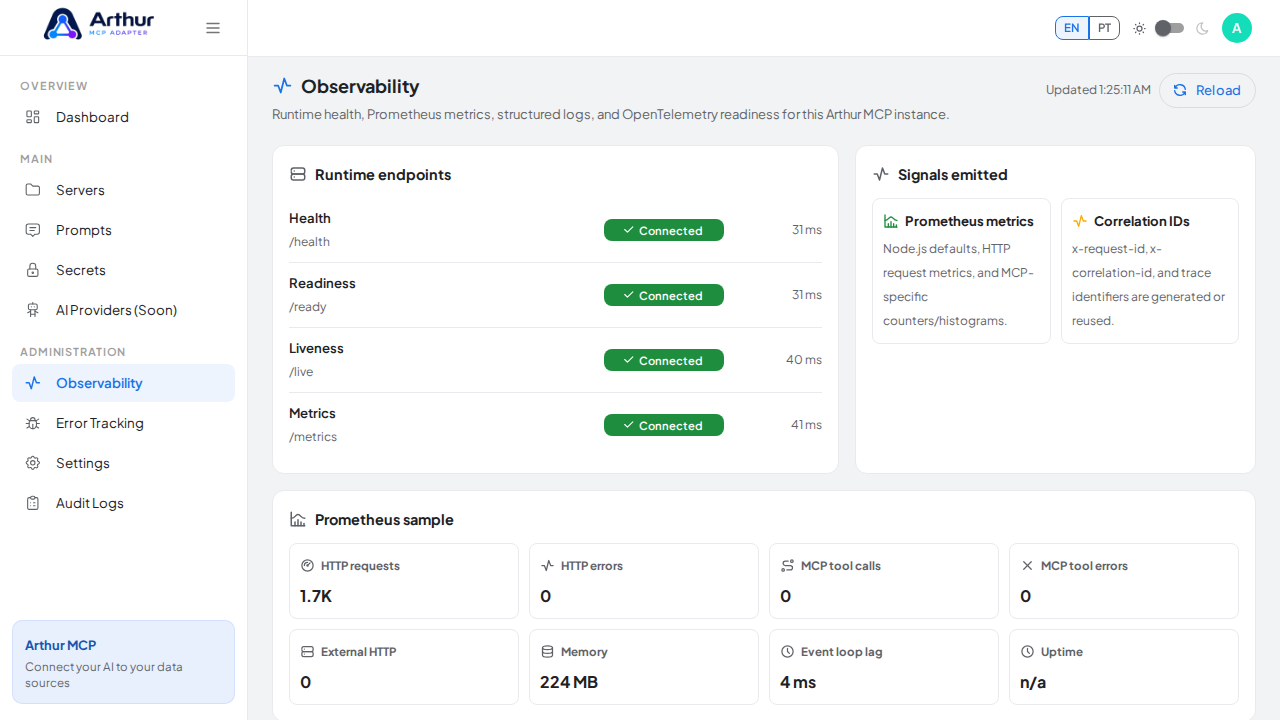
Arthur MCP exposes the operational signals a team needs to run it in production, so problems surface before someone has to go digging.
What you can do
- Check instance health at a glance — is the app up, ready, and live?
- Read structured logs with correlation IDs, so a single request can be traced end to end.
- Pull Prometheus metrics for dashboards and alerting.
- Enable optional OpenTelemetry tracing for deeper request-level visibility.
- Import a ready-to-use Grafana dashboard, backed by local Prometheus, Grafana, and Tempo helper configuration.
How to use it
- Go to Observability to see the current, live status of health checks, metrics, and tracing on this instance.
- Point your monitoring stack at the exposed health and metrics endpoints.
- Import the provided Grafana dashboard if you want a ready-made view instead of building one from scratch.
Good to know
- Health and metrics endpoints are intentionally public, since monitoring infrastructure needs to reach them without authenticating.
- Related: Settings for the read-only Observability tab, Error Tracking and Audit Logs for two other kinds of visibility.
Tutorial video